Query Optimization with PostgreSQL Execution Plan Visualizer
In the world of database management systems, PostgreSQL stands tall as one of the most powerful and versatile options available. However, even seasoned developers can find themselves facing challenges when it comes to optimizing database queries for performance. Enter the PostgreSQL Execution Plan Visualizer—a tool that can turn the seemingly complex task of query optimization into a streamlined and intuitive process.
Understanding the PostgreSQL Execution Plan
Before we delve into the visualizer itself, let’s take a moment to understand what the PostgreSQL execution plan is all about. Essentially, the execution plan outlines the steps that PostgreSQL will take to execute a given query. This includes details such as which indexes will be used, the order in which tables will be scanned, and any additional operations that may be necessary, such as sorting or joining data sets.
The Challenge of Query Optimization
Optimizing database queries for performance can be a daunting task, particularly for queries that involve multiple tables, complex joins, or large data sets. Without a clear understanding of how PostgreSQL will execute a given query, developers may find themselves resorting to trial and error—a time-consuming and often frustrating process.
Introducing the PostgreSQL Execution Plan Visualizer
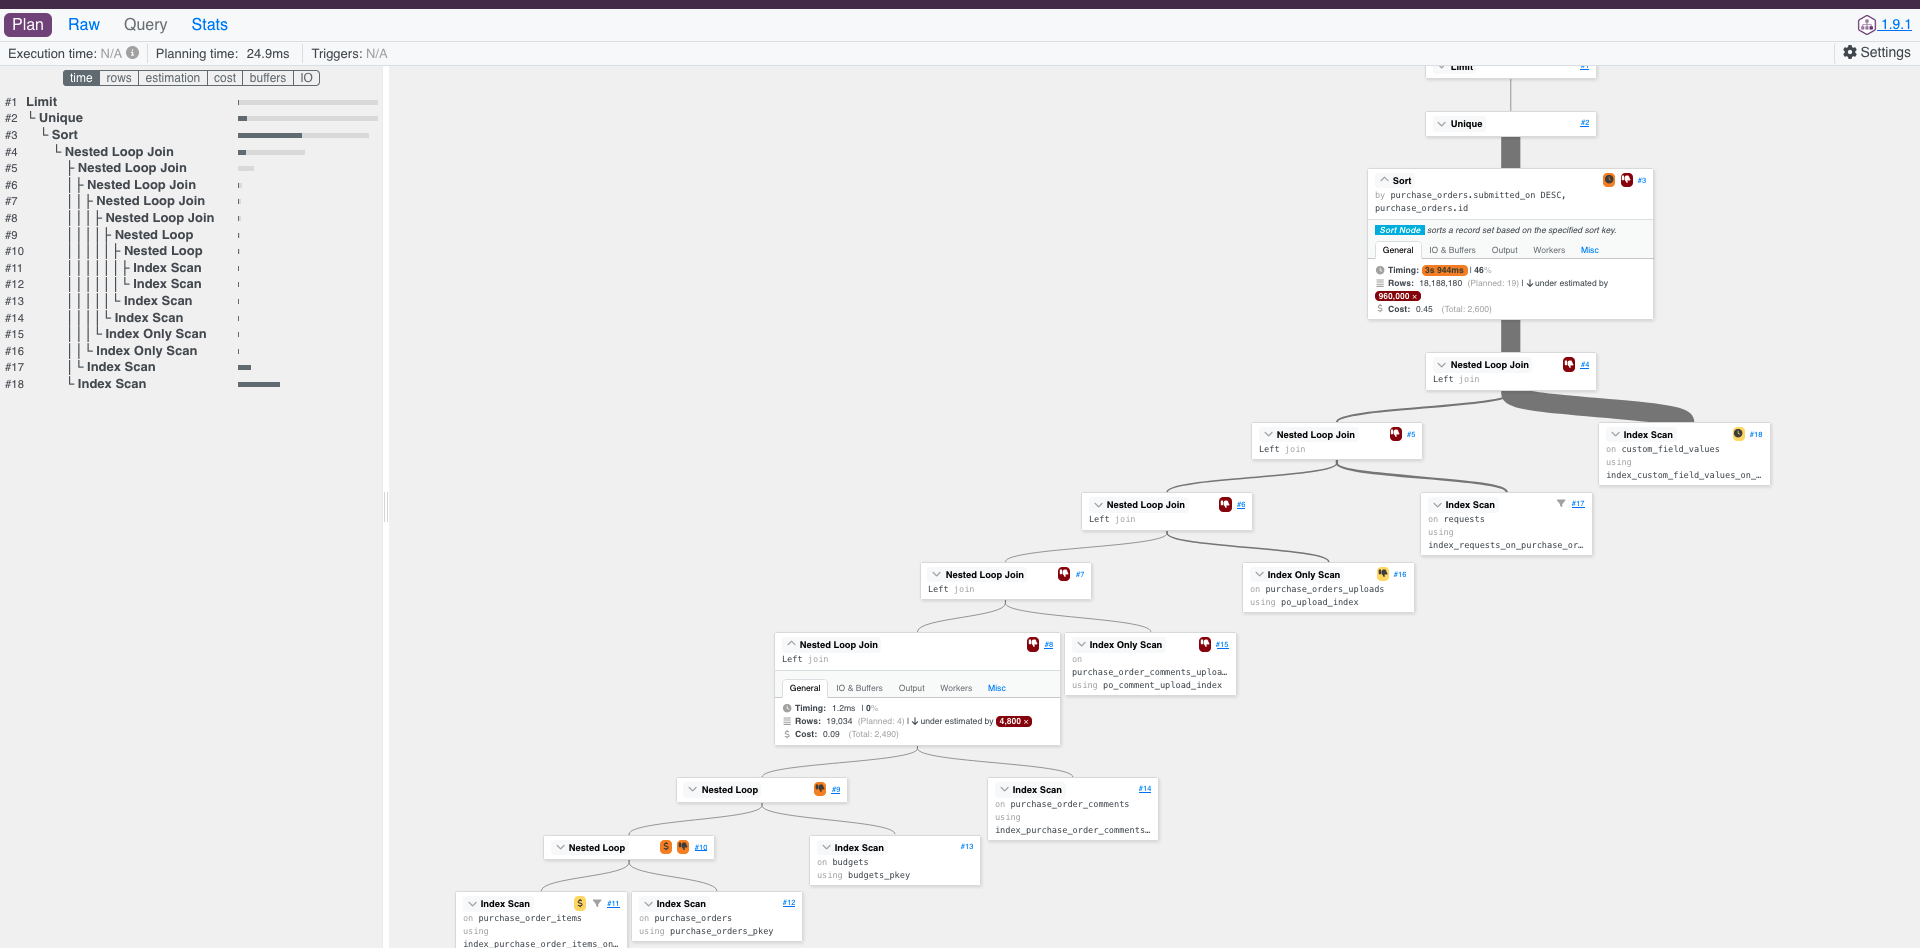
This is where the PostgreSQL Execution Plan Visualizer comes into play. Developed with the needs of developers in mind, this powerful tool provides a visual representation of the execution plan for any given query. By simply inputting a query into the visualizer, developers can instantly see how PostgreSQL plans to execute it, allowing them to identify potential bottlenecks or inefficiencies at a glance.
The significance of using EXPLAIN ANALYZE in SQL query is to interpret the resulting execution plans. This will provide valuable insights into query performance optimization.
-- Example 1: Simple SELECT query
EXPLAIN ANALYZE
SELECT * FROM users WHERE age > 25;

-- Example 2: JOIN query
EXPLAIN ANALYZE
SELECT u.name, p.title
FROM users u
JOIN posts p ON u.id = p.user_id
WHERE u.age > 25;

-- Example 3: Aggregation query
EXPLAIN ANALYZE
SELECT department, AVG(salary) AS avg_salary
FROM employees
GROUP BY department;
Key Features and Benefits
Visual Representation: The visualizer presents the execution plan in an intuitive and easy-to-understand format, making it accessible to developers of all skill levels. Identify Performance Issues: By visualizing the execution plan, developers can quickly identify potential performance issues such as sequential scans, inefficient joins, or missing indexes. Optimize with Confidence: Armed with insights from the visualizer, developers can make informed decisions about how to optimize their queries for maximum performance, saving time and frustration in the process.
Getting Started with the PostgreSQL Execution Plan Visualizer
Ready to supercharge your query optimization efforts? Getting started with the PostgreSQL Execution Plan Visualizer is easy. Simply visit https://explain.depesz.com/ or https://explain.dalibo.com and input your query. Within seconds, you’ll have a clear visual representation of how PostgreSQL plans to execute it, allowing you to optimize with confidence.
To optimize performance there is a term called N + 1 queries which needs to avoid. Thus, we might need to load associated records in advance and limit the number of SQL queries call made to the database using :includes also referred to as eager loading. Depending on the requirement of your query, :includes will use either the ActiveRecord method :preload or :eager_load.
But there might be certain situation, where we blindly follow :includes, and, add unused association just a shake of solving N + 1, and later, it creates another performance issue something like PG::InternalError: ERROR: invalid memory alloc request size. That means we are preloading huge number of unwanted records in memory and the size of memory exhausted, issue is visualize in following screen. In this case, we need to optimize by removing unwanted association added inside includes that exhaust memory.
Conclusion
In the fast-paced world of database management, optimizing query performance is essential. With the PostgreSQL Execution Plan Visualizer, developers can take the guesswork out of query optimization and streamline the process for maximum efficiency. Try it out for yourself and see the difference it can make in your development workflow.