PowerBI data analysis and visualization
Power BI: AI-Powered Data Visualization for Modern Businesses
Microsoft Power BI has transformed from a simple reporting tool into an intelligent analytics platform that combines data visualization with artificial intelligence. This evolution makes advanced analytics accessible to organizations without requiring extensive technical expertise.
Key AI Features That Drive Intelligence
Smart Narratives and Auto-Generated Insights Power BI automatically generates written summaries of your data, explaining key trends and outliers in plain English. Complex visualizations become digestible insights that stakeholders can quickly understand and act upon.
Q&A Natural Language Processing Users interact with data using everyday language, asking questions like “What were our sales last quarter?” The AI interprets these queries and generates appropriate visualizations instantly.
Anomaly Detection and Forecasting Machine learning algorithms continuously monitor data streams to identify unusual patterns while built-in forecasting capabilities predict future trends using historical data.
Real-World Impact Across Industries
Organizations across sectors leverage Power BI’s AI capabilities for various applications: retailers analyze customer behavior and predict demand, healthcare providers monitor patient outcomes and operational efficiency, financial institutions detect fraud and assess risks, while manufacturers optimize production schedules and predict maintenance needs.
Core Benefits of AI-Enhanced Visualization
Democratized Analytics: Intuitive interface and natural language capabilities make advanced analytics accessible to non-technical users.
Faster Decision-Making: Automated insight generation accelerates the journey from raw data to actionable intelligence.
Improved Accuracy: AI algorithms process vast amounts of data with consistency, reducing human error and bias.
Scalable Intelligence: AI capabilities scale automatically as organizations grow and data volumes increase.
Implementation Best Practices
Success with Power BI begins with clean, well-structured data and clear business objectives. The platform includes data preparation tools and suggests optimal visualization types based on your data characteristics. Regular model updates and user training maximize the value of AI-driven insights.
The Future of Intelligent Analytics
Power BI continues evolving with enhanced natural language processing, sophisticated predictive models, and integration with other Microsoft AI services. This combination of human creativity with machine learning capabilities enables a new level of data-driven decision making.
Conclusion
Power BI’s AI-enhanced visualization capabilities transform how businesses interact with data by automating insight discovery and providing predictive analytics. As data complexity grows, these intelligent tools become essential for competitive advantage, enabling organizations to make faster, more informed decisions regardless of their size or technical expertise.
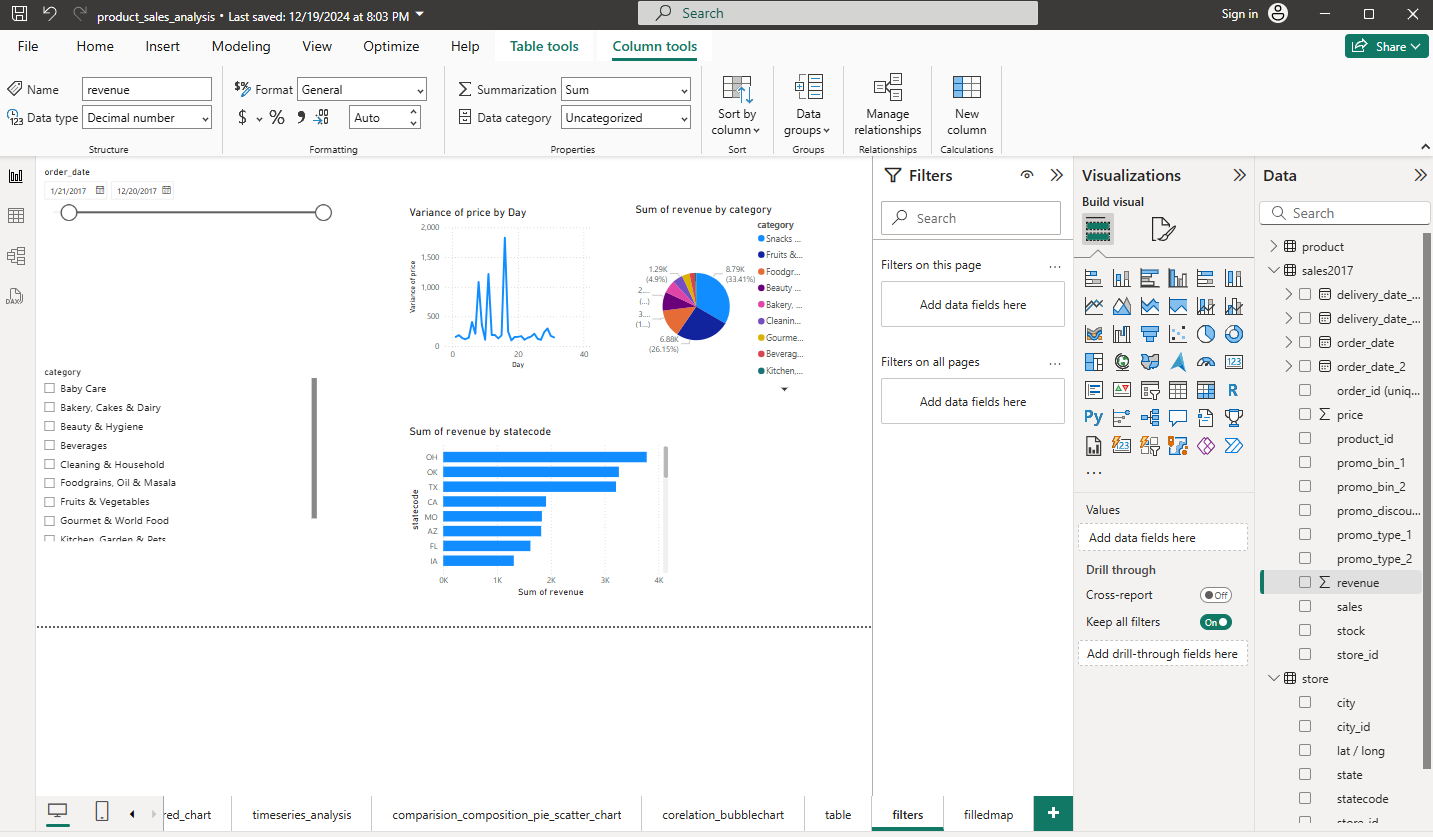
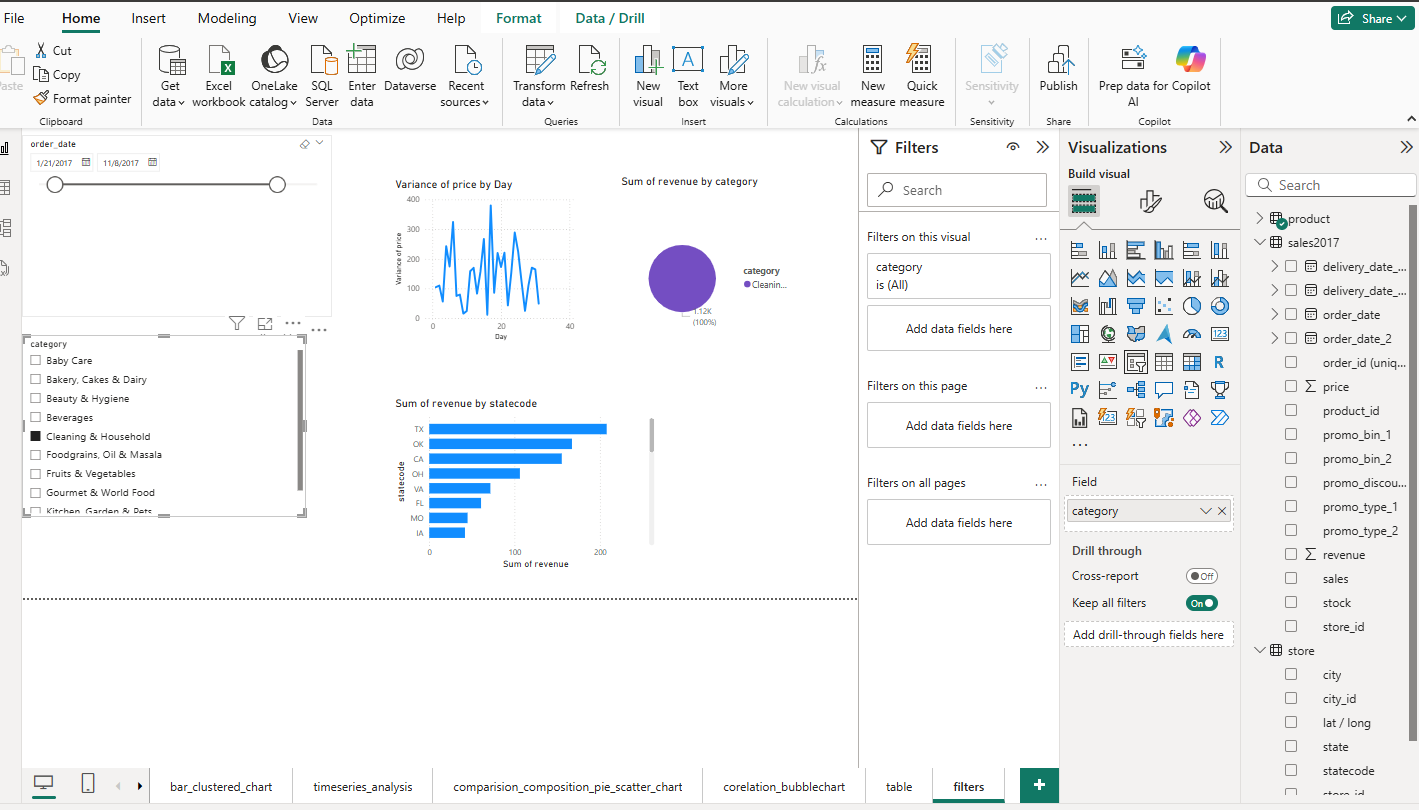
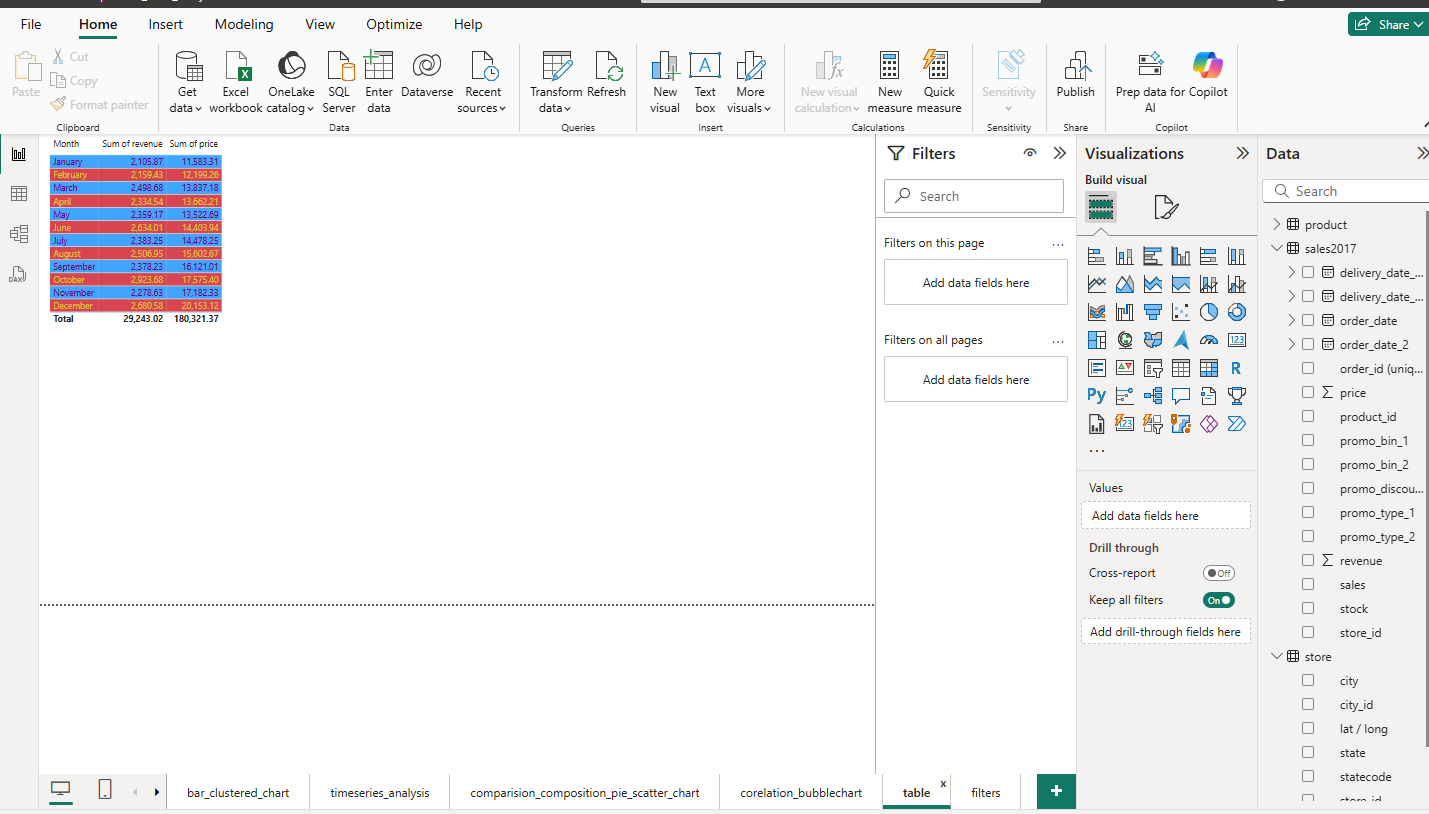
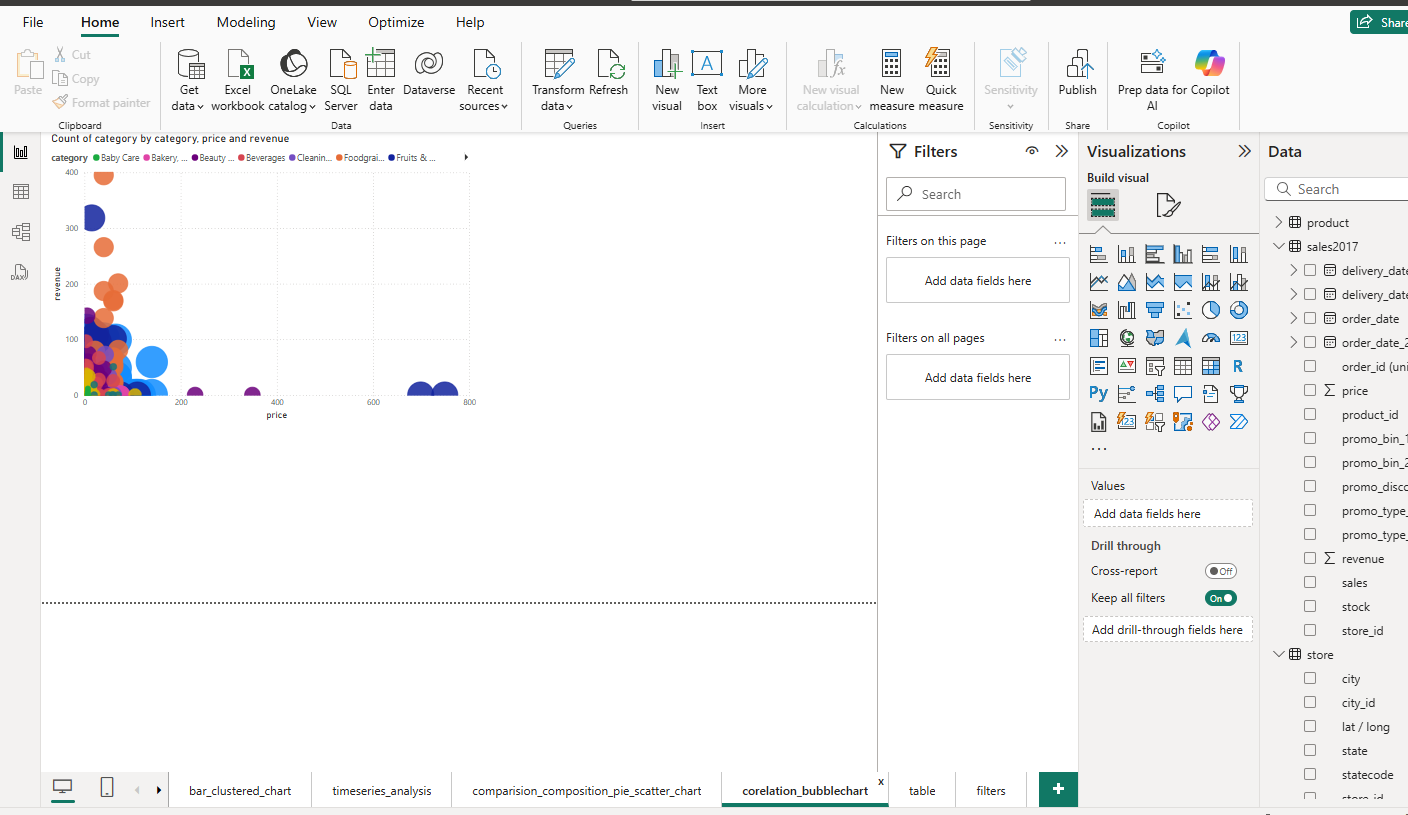
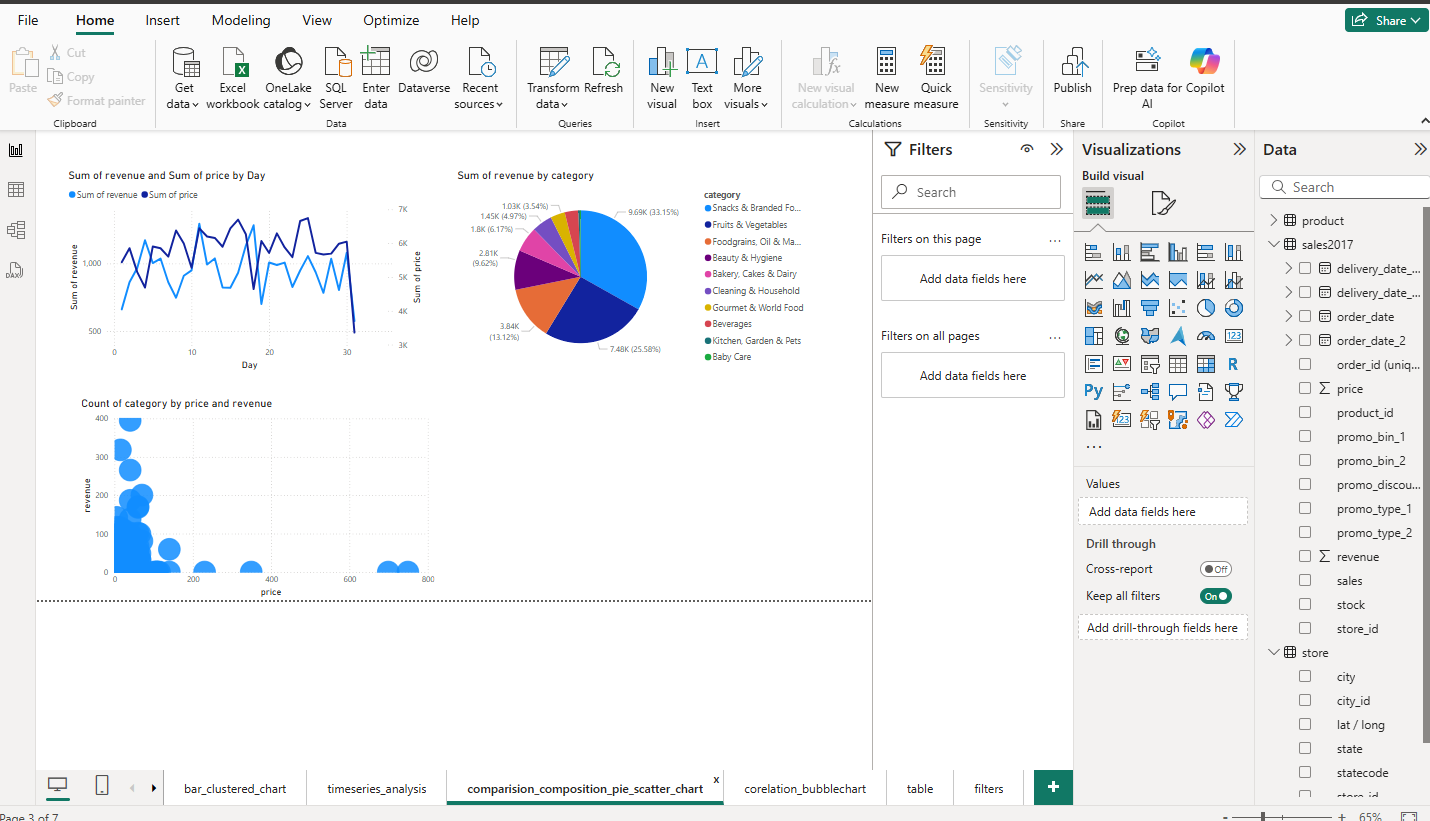
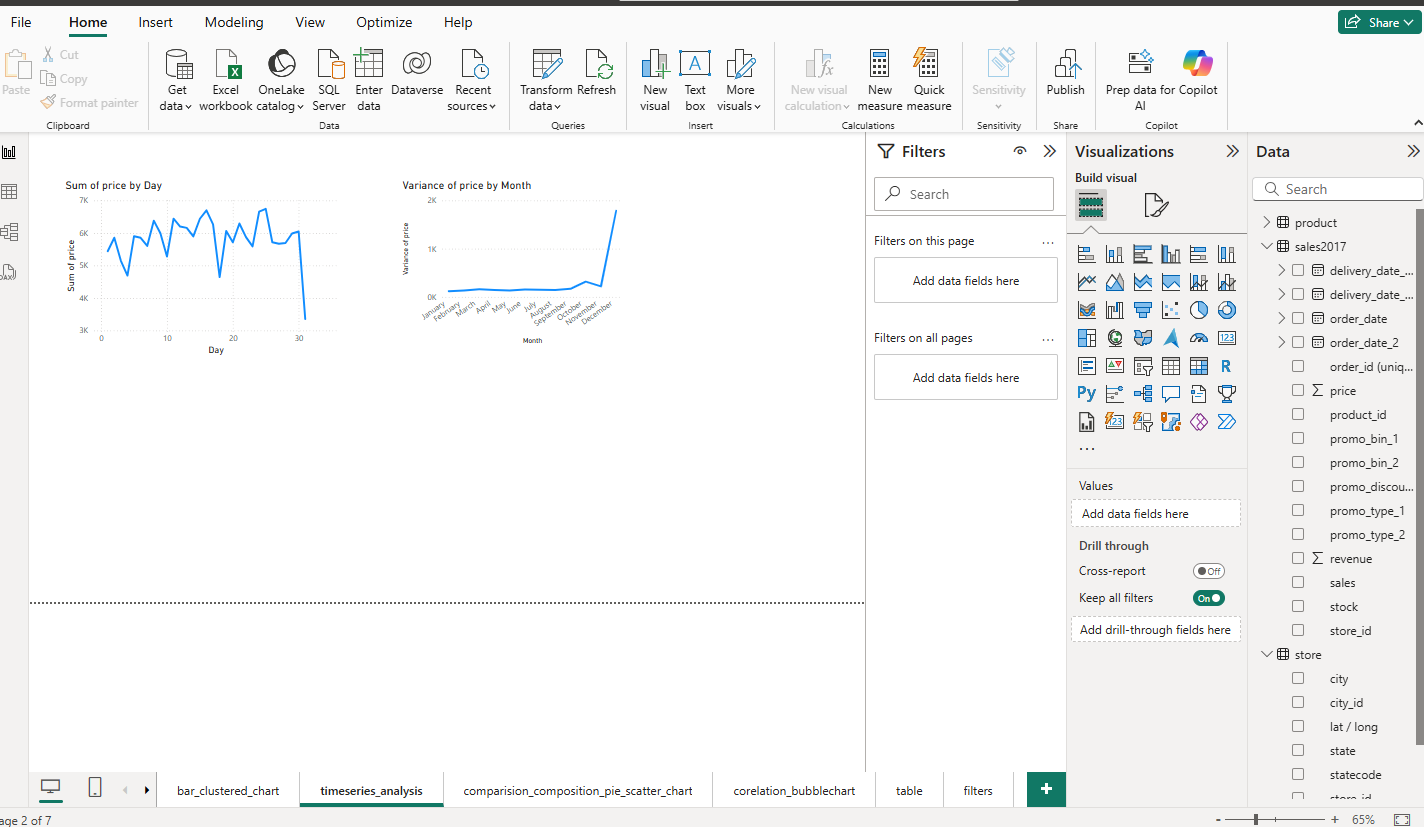
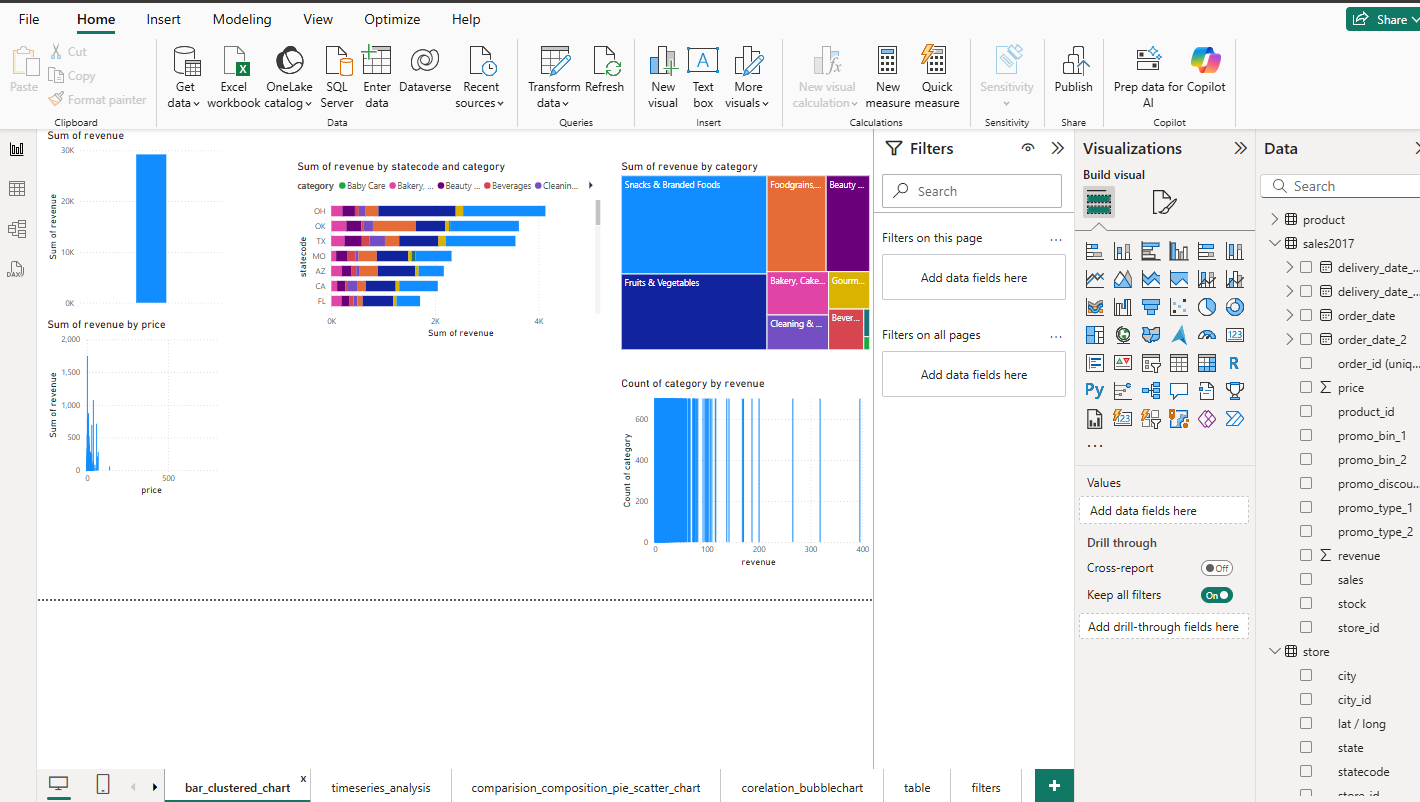
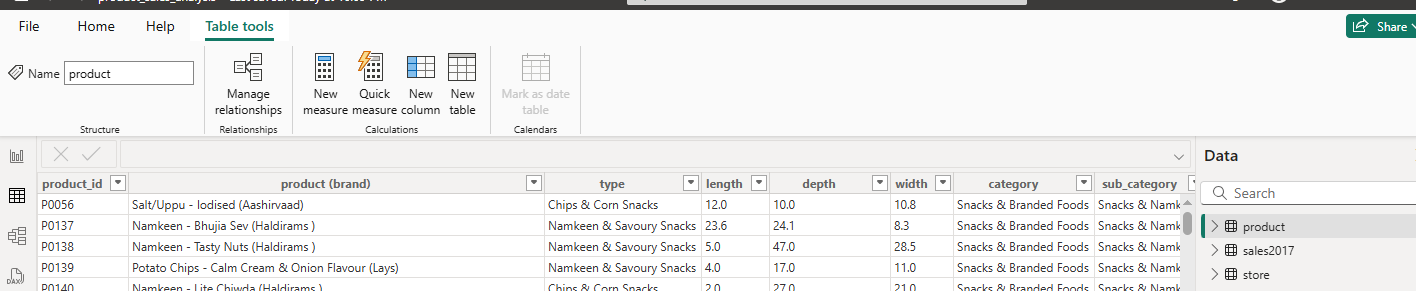
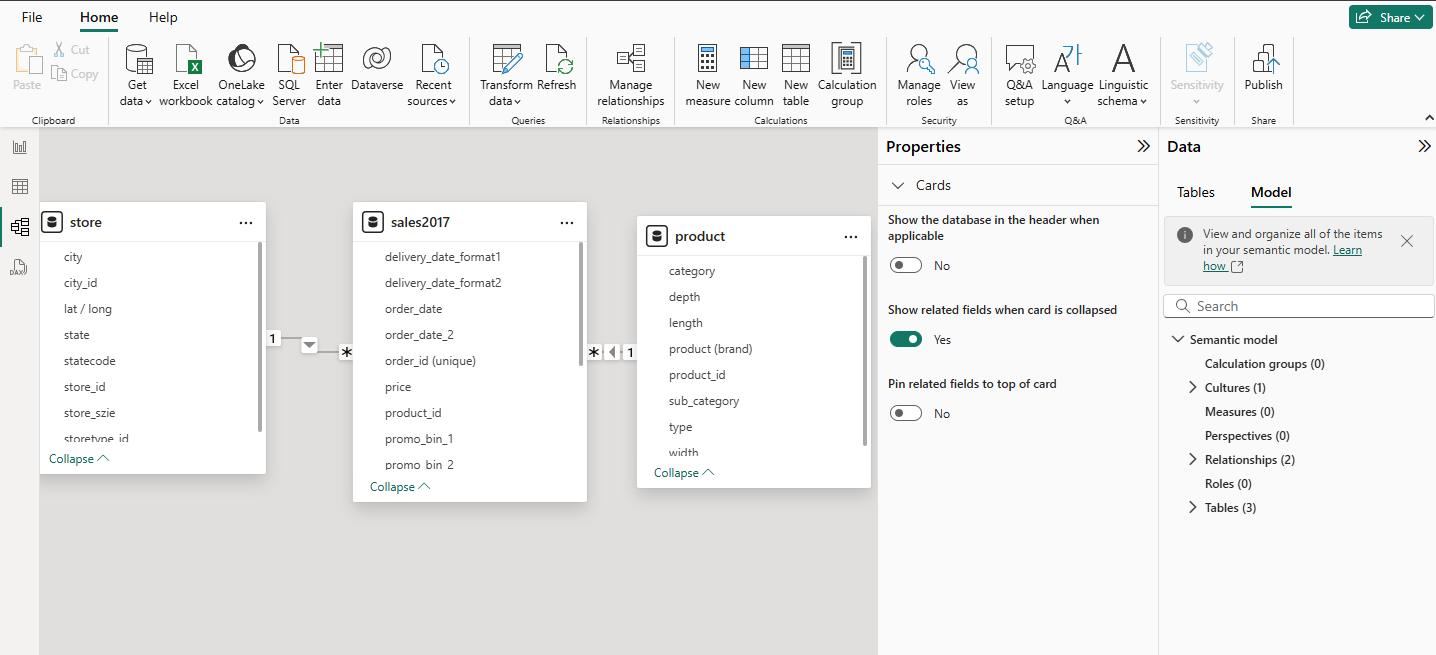
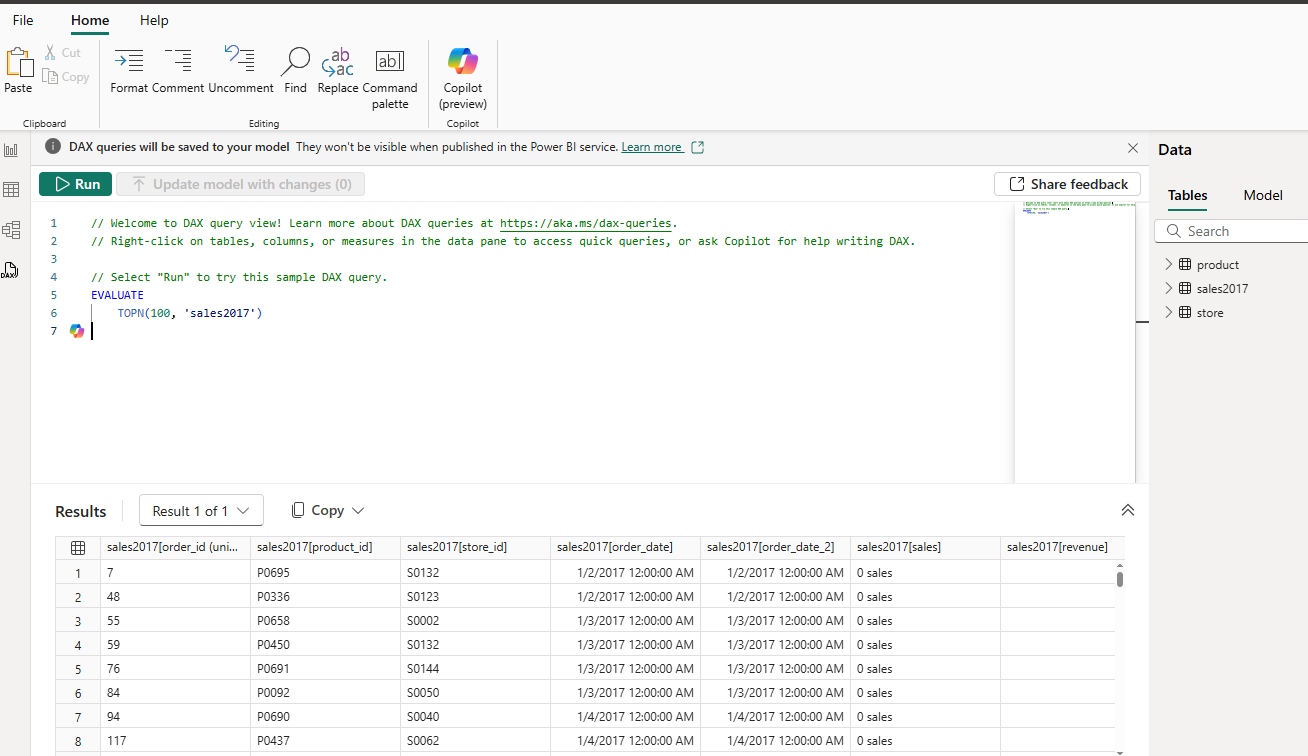
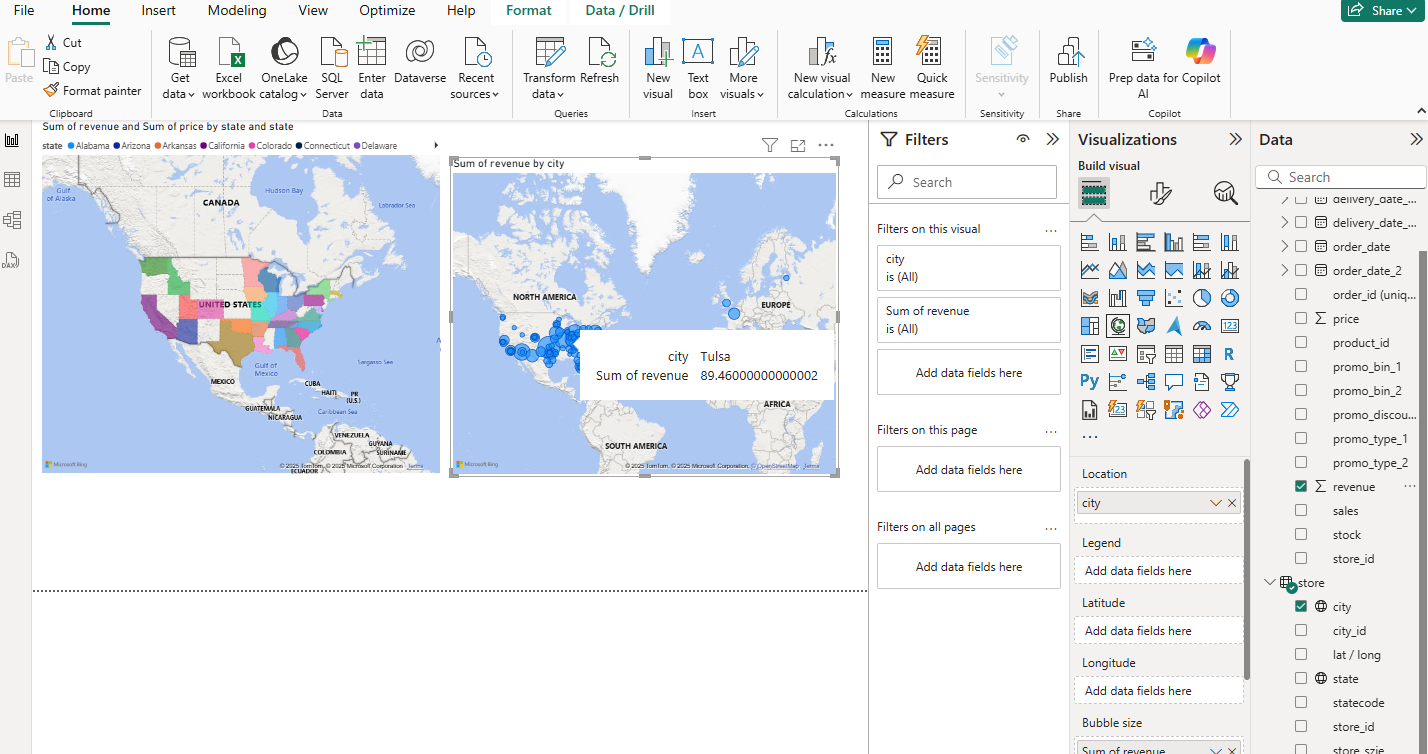
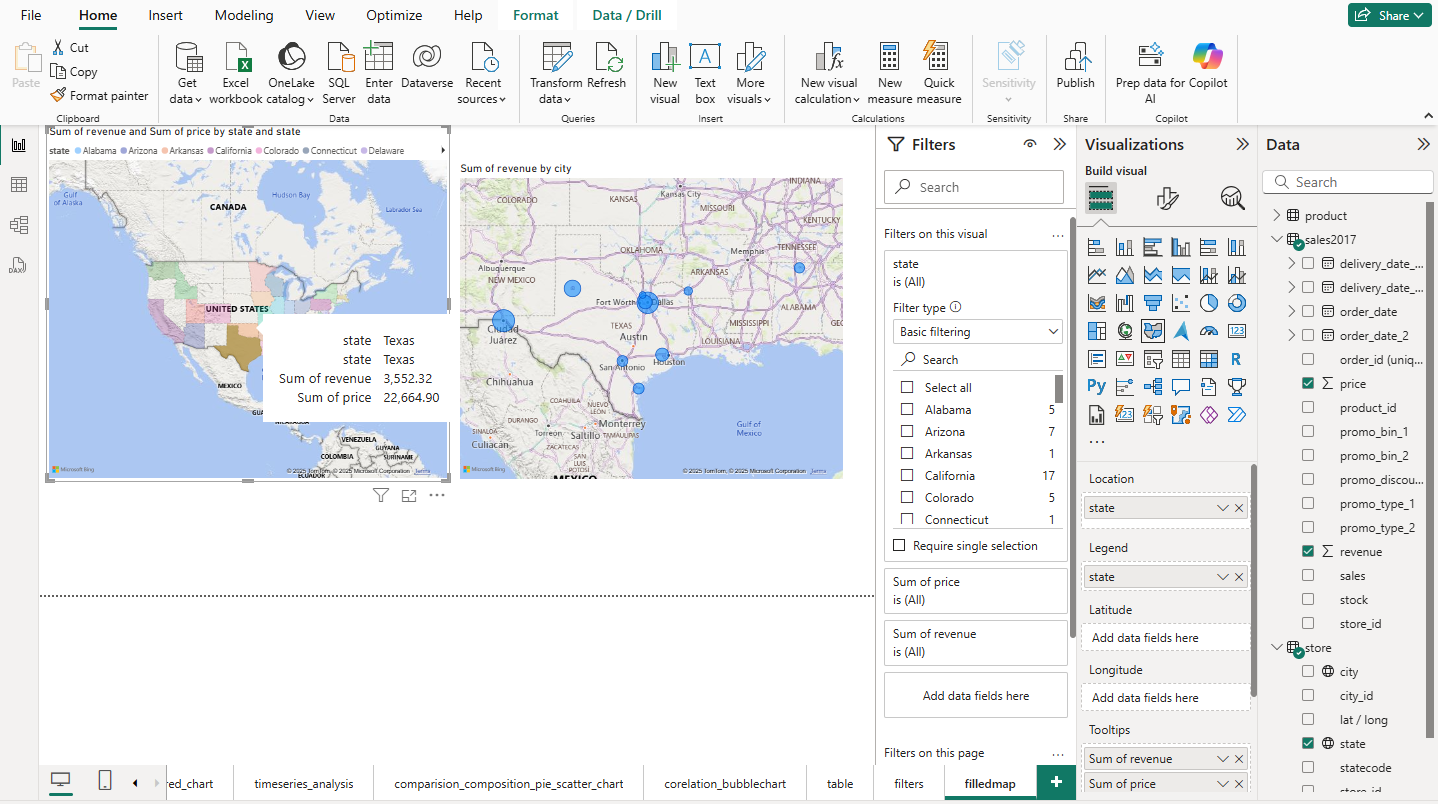
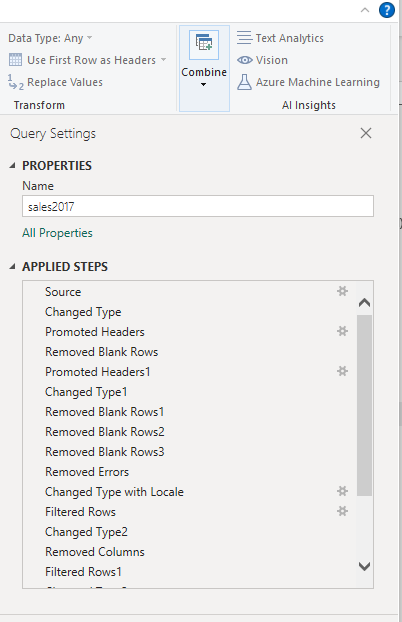
Power BI in Action: A Visual Walkthrough
To demonstrate Power BI’s capabilities in practice, here’s a step-by-step visual guide showing the platform’s key features and interface elements: